
Material movement diagram
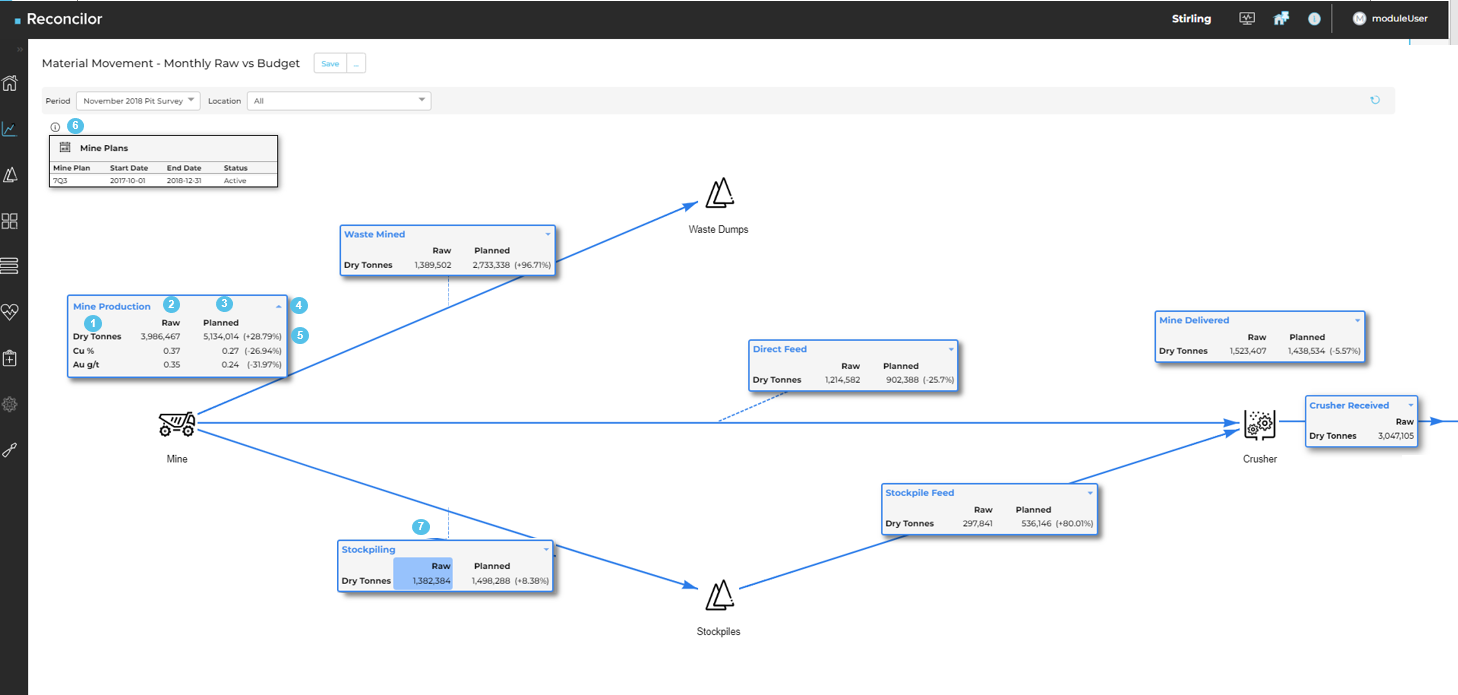
The example diagram below shows the Mine to Crusher view of the mine value chain. The other views (Crusher to Plant Product and Transport and Shipping) work similarly, and the key information annotated on the example applies to all views.
The diagram represents parts of the mine operation and shows material flows (lines) between sources and destinations (icons). The data displayed in the diagram components depends on the options and settings selected in the Configure panel.
To view and interact with the diagram:
- When the diagram first loads, the components (grey boxes with datasets) display in collapsed mode. If collapsed, only data for the first measure displays. Expand the component to see all measures. Click the arrow in the component's top right corner to expand or collapse (annotation 4).
- View the measures and datasets for each component. The component data and layout is controlled by the options selected on the Configure panel.
- The first column (annotation 1) lists the selected Measures; for example, tonnes, volume or grade attributes. The display order is controlled by the order in which you select the measures on the Configure panel.
- The second column (annotation 2) shows the display name and data for the first dataset selected in the Configure panel—in this example, a Raw movement dataset. The vertical order of the dataset boxes in the Configure panel corresponds to their horizontal column order in the diagram components.
- The third column (annotation 3) shows the display name and data for the second dataset—in this example, a Planned movement dataset. Subsequent datasets display in additional columns.
- The percentage difference between the first and second (or subsequent) datasets (annotation 5) displays if the Display % difference to first dataset box is selected in the Configure panel. In this example, enabling this setting makes it easier to compare the Planned and Raw values.
- If any Planned datasets are included, click the information icon (annotation 6) to see the details of the mine plans used. If multiple plan names are used in a period, each is listed with its active period dates and status.
- To see the detailed movement data for any dataset in the diagram, click its column in the component box (annotation 7). The selected dataset column is highlighted blue. The diagram compacts and the material movement table displays the associated data for further analysis. See Material movement table for an example and how to work with the table.
