
Viewing Multivariate Simulation Scatter Plots
In Supervisor, two types of scatter plot are associated with Multivariate Simulation Generation.
- Factor Results Scatter Plots – Generated after running the Multivariate Simulation. See Configure Factor Results Scatter Plot Properties.
- Back Transform Results Scatter Plots – Generated after back-transforming the results. See Draw and Configure a Scatter Plot.
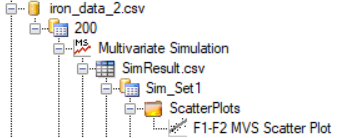
The image below shows the Project Tree layout with a Factor Results Scatter Plot inserted.
The image below shows the Project Tree layout with a Back Transform Results Scatter Plot inserted.
![]()