Configure material movement
Material movement data and display configuration is broadly similar to other screens in Reconcilor, with a few key differences. Most notably, you can set up the Material Movement screen to show one of three views of the mine value chain. Each view presents a distinct set of diagram components and includes filters specific to its associated datasets. You can view the detailed movement data from each dataset in the diagram in a table for further analysis.
Activity steps:
- Open the Material Movement screen.
- Click the Configure icon on the right hand toolbar.
The Configure panel displays.
- Select the mine value chain view you want to configure from:
- Mine to Crusher
- Crusher to Plant Product
- Transport and Shipping
Note: See Diagram components by view option below for what displays in each view.
- Select the Measures to display in the diagram and supporting data table. Drop-down list options include volume, tonnes, grade, metal/product and so on. You can select multiple options. The order in which you select options determines their display order in the diagram components. To change the order, click Clear and select the measures again in your preferred order.
- Select whether to Display % difference to the first dataset. If selected, percentage differences display when you expand components in the diagram. The percentage difference is always relative to the first dataset.
- To add a dataset to the diagram, click + Add Dataset.
Note: Each dataset displays in its own box in the Configure panel. You can use the up and down chevron arrows in the top left corner to hide or show the dataset fields.
- Configure each dataset.
- Select the Measure Type from:
- Raw: Raw movement data from your site's source systems.
- Adjusted: Movement data that incorporates moisture, density or stockpile adjustments.
- Planned: Movement data from your site’s mine plan(s) that can be added for comparison purposes. If selected, a Mine Plan Type filter displays, for which you must select a value.
- Enter a Display Label.
- Select Affected Movements to display. You can select multiple options.
- Apply Filters to the dataset as required. The available filters vary depending on the selected mine value chain view. When you select a filter, another drop-down list displays to select the applicable Filter Values.
Note: See Dataset filters by view option below for which dataset filters apply to each view. An example of how filters affect the diagram display is also included below.
- Select the Measure Type from:
- Use the arrows in the top right of the dataset box to move it up or down in the display order if required. The vertical order of the dataset boxes in the Configure panel corresponds to their horizontal column order in the diagram components.
- Click Apply to update the screen's diagram and table and keep the Display Options panel open.
- Click Apply & Close to update the screen's diagram and table and close the Display Options panel.
Diagram components by view option
| View | Diagram Components |
|---|---|
|
Mine to Crusher |
|
| Crusher to Plant Product |
|
|
Transport and Shipping |
|
Dataset filters by view option
Reconcilor can add one or more filters for all datasets. It is important to note that the filter only applies to the dataset it is attached to. Filters can be source or destination locations, material types, lithology types, contractor names or batches.
| View | Dataset Filter Options |
|---|---|
|
Mine to Crusher |
|
| Crusher to Plant Product |
|
|
Transport and Shipping |
|
Example: The image below shows a dataset filter for Stockpiling movements. The filter is Destination Stockpile with the stockpile name as the selected value. The stockpile name is also used as the dataset display label.
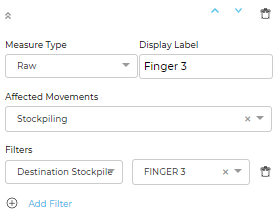
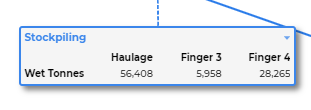
With these filter settings, the Finger 3 stockpile data displays on the Stockpiling component of the diagram as shown below.