
Look for Duplicates
Objectives
The Look for Duplicates functionality is designed to find duplicated samples, meaning samples at the same location (or very close to each other). These samples may cause problems during the kriging matrix inversion.
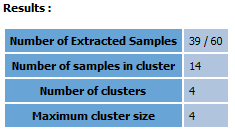
Two samples are said to be duplicates if, for a given variable, their values are not undefined and the distance between the two samples is less than a given value. One sample can have more than one duplicate and the duplicates related to a single sample constitute a group.
Interface
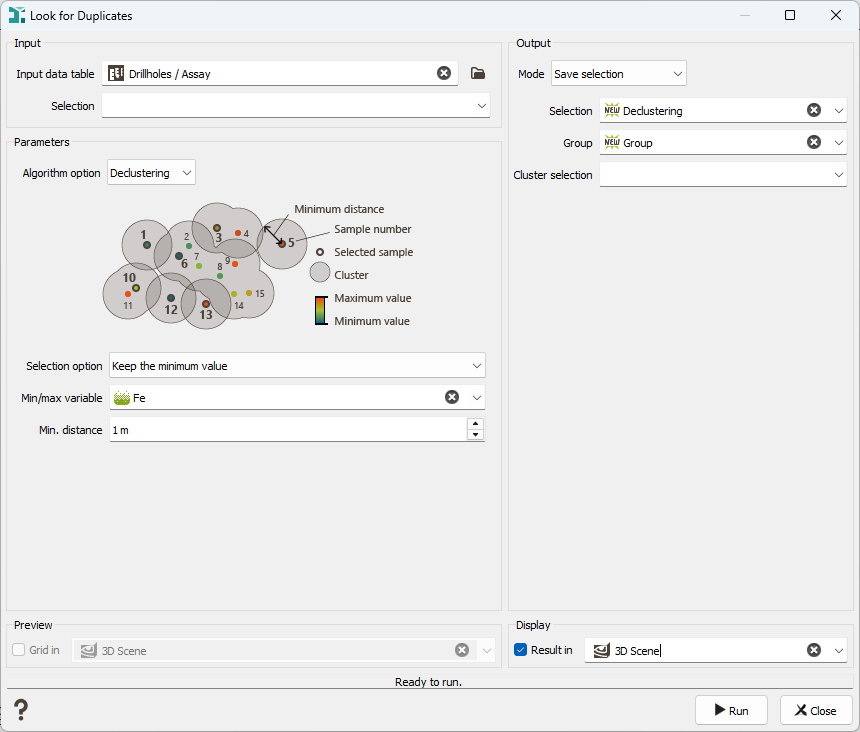
-
Input:
- Data table: Choice of the data table on which the Look for Duplicates task will be applied.
- Selection: Choice of the selection (as a restriction of the Input Data table) to apply the Look for Duplicates task.
-
Algorithm: Two algorithms have been developed to find the duplicates.
-
Sampling algorithm: The algorithm starts with the first sample number. It creates a cluster including itself and all the other points contained in a circle (or sphere) with the minimum distance chosen by the user as a radius. Then it moves to the second point and applies the same process.
All the points already included in a previous cluster are not processed again. All the points that may have been in two different clusters are, in fact, only in the first created cluster.
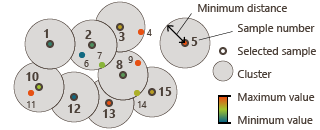
This method is the recommended algorithm as it is the fastest.
The major problem may be a memory problem in case of very big data.
-
Declustering algorithm: The algorithm starts with the first sample number. Then it calculates the distance between each pair of samples and compares the distance to the chosen minimum distance. If the length is smaller, the point is added to the cluster. The cluster becomes bigger and bigger, until no more samples are reached.
This algorithm might be long since it calculates all the distances between the points.
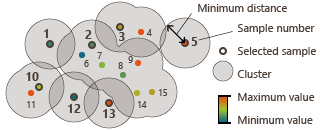
A problem may occur when the data samples have a high connectivity. The algorithm will consider all the points in only one cluster.
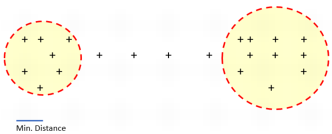
In the following example, there are two clusters localized at the extremities of the data set, but they are linked by some intermediate samples. If the minimum distance chosen is large enough to take a point in the trajectory, all the points will finally be included in a unique big cluster.
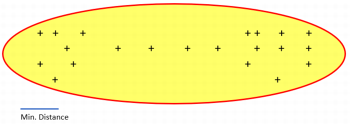
However, if the minimum distance is small and does not reach the trajectory points, the intermediate points will not be included in the first cluster and the result will be two distinct clusters, one at each extremity.
- Selection option: To choose which sample will be kept between the duplicates, the following options are available:
- Keep the smallest sample number: the sample that is defined first in the input file is kept.
- Keep the highest sample number: the sample that is defined last in the input file is kept.
- Keep the minimum value: the sample which has the lowest value of the chosen variable is kept
- Keep the maximum value: the sample which has the greatest value of the chosen variable is kept
- Min/Max variable: Choice of the variable that will be used if the Selection option "Keep the minimum value" or "Keep the maximum value" has been selected.
- Min. distance: A number must be chosen at this step. This number corresponds to the minimum distance between two samples. It means that if two samples are closer than this distance, they are considered as duplicated samples and only one of them is selected.
- Selection option: To choose which sample will be kept between the duplicates, the following options are available:
-
Grid sampling algorithm: This algorithm creates a subsample by selecting at most one input sample per grid cell of a regular (virtual) grid. Two options are available when selecting a point:
-
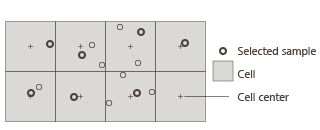
Keep the closest sample to the cell center: This mode keeps the sample located closest to the center of the cell.
-
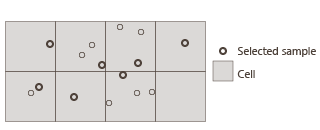
Keep a random sample: This mode randomly keeps one of the samples that fall inside each cell. The Seed controls the random selection; changing it produces different results.
After choosing the selection option, you need to define the grid geometry:
- Infinite grid: Check this option to automatically expand the grid, so that all samples are assigned to a cell (grid extents are derived from the data).
- Origin: The X, Y, and Z (if 3D) coordinates of the origin. If the grid has no rotation applied, then the origin is always at the lower-left of the grid in X and Y, and the Z value is at the bottom of the grid.
- Mesh: The dimensions of the grid cells in X, Y, and Z (in 3D).
- Number of cells: The number of grid cells in each direction (X, Y, Z).
- Rotation: A rotation to apply to the whole grid.
- Get grid geometry from input data: A default grid geometry is provided by the program using the minimum and maximum values along X, Y and Z of the data file by pressing this button.
- Preview grid: Enable this option to display the virtual grid in the selected 2D or 3D scene. The preview updates automatically whenever the grid parameters (number of cells, mesh size, etc.) are modified.
-
-
-
Output:
-
Mode:
-
Save selection: a selection will be created in the input data table, containing only the selected samples (without the duplicated samples)
- Selection: the name of the new selection.
- Group: to give a name/number to different groups. Optional.
-
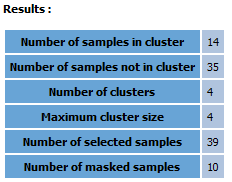
Cluster selection: a selection of the samples inside a group. A 1 will be attributed to the samples which are inside a group and a 0 to the orphan samples.
-
Extract selected points: a new file will be created only with the selected samples (without the duplicated samples). This mode is not compatible with the Grid sampling algorithm.
- Output data table: the name of the new data table.
- Compute cluster's center of gravity: if activated, the output samples will be located at the gravity center of the group they belong to. If not activated, the output samples keep the same coordinates as the selected samples.
- Variables and Statistics mode: possibility to compute the statistics (minimum, maximum, mean and migration) of several variables
-
Copy other variables: if activated, all the variables in the file will be copied.
-
-
